All posts by hfcyclists

Why the A315 is the best route for CS9

There’s been some talk about routing CS9 down the A4 instead of Chiswick High Road and King Street (aka the A315). Fans of this idea have touted it as a perfect pain-free solution, given the existence of a cycle track of sorts on it (in reality, legalised cycling on the pavement), and its distance from residential areas. But there are downsides to this route that its proponents haven’t mentioned. We really wish people pushing the A4 route were willing to look into the details. We also think the local political parties who have been advocating the A4 for CS9 without any consideration of the issues it raises, especially to the residents who would be most directly affected, have been particularly negligent in this regard.

Let’s look at the four big reasons why the A315 is the best route, and the things that proponents of the A4 route don’t want you to hear.

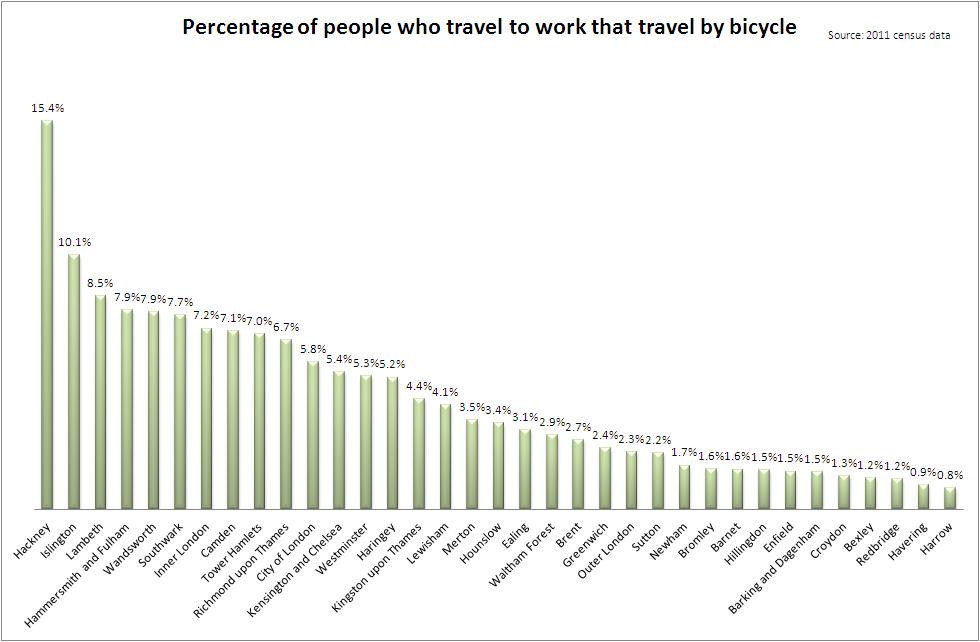
1. A significant majority of people prefer the A315

Firstly, look at the number of people cycling down the A4 as opposed to the A315. Department for Transport traffic counts show between three to six times more people cycling along the A315 compared to the A4.

Source: https://www.dft.gov.uk/traffic-counts/
People who cycle have already voted for their choice of route. Protected cycle infrastructure along the A315 is therefore a considerably better investment in terms of the number of people who will use the route.
To emphasise this, the TfL consultation showed 60% support for the A315 route.

Advocates for alternative routes need to show evidence they are better used than the A315, and are supported by the public.

2. Because cyclist and pedestrian safety along the A315 needs to be improved

The A315 has a poor record for pedestrian and cyclist safety and has been claimed to the “fourth most dangerous road in Britain” based upon collisions per distance travelled. The collision rate along Chiswick High Rd and King St is representative of the overall road. Each star represents a collision involving a cycle or pedestrian between 2005 and 2016. It’s not pretty.


Source: https://bikedata.cyclestreets.net/#17/51.49257/-0.25328/opencyclemap

Advocates for alternative routes need to explain their proposals to improve cyclist and pedestrian safety along the A315.

3. Because it will be used for ALL types of journeys

Transport for London research has identified 8.17 million daily trips made by motorised modes that could be cycled. Of these, 6.47 million trips could be cycled by most people in less than 20 minutes.
Over half (53%) of potentially cyclable trips are for shopping and leisure while 17% are for commuting.
Even for current cycling trips in London, over half (51%) are for shopping and leisure while 28% are for commuting. That demonstrates huge potential for increased cycling in London.


Cycle superhighways being “only for commuters” is a myth. To be used by the maximum number of people, the routes must cater for people using them for shopping and leisure purposes as well as going to work. That means the routes must go through the main town centres of Hammersmith, Chiswick, Brentford and Hounslow and not bypass them, as a route along the A4 would do.
Like any mode of transport, the purpose of people using the route will change by time of day and day of week. At 8am on a weekday, CS9 will have mainly people going to work. During other times however, it will be people going shopping or visiting the other amenities along the route.
There is substantial evidence that cycling improves the local economy. Research on London shopping streets has found people coming by car visit less often and spend less per month than people using other modes of transport. We understand the concerns of businesses to any possible downsides, but the it is wrong to claim that these concerns confirm a loss in trade will occur, when in fact quite the opposite will most likely occur if past schemes are any guide.

Advocates for alternative routes need to show why they would be used for people shopping and visiting other amenities.

4. Because the people who are proposing the A4 don’t understand the problems it would cause

Now for the elephant in the room. Invariably we find that people proposing the A4 have done no investigation into what would be required to turn it into a proper cycle route rather than the current situation, which is cycling on a pavement shared with pedestrians.
With the A4 option, CS9 would either be two segregated tracks on either side of the A4, or a two-way segregated track on one side. On the north side, the subway tunnels produce pinch points, leaving only room for one lane of CS9. That would require removing pedestrian access from one direction to the subways. On the south side there are also pinch points, leaving room for only a single lane of CS9, for example between Sutton Court Road and Eastbourne Road, in this case with complete loss of the pedestrian access. Therefore CS9 would have to be one lane on each side the A4, and it would require losing portions of pedestrian access along both sides.
If we want a dedicated cycleway and not just the current shared use provision, this would also require closing down pedestrian access to the existing tunnels, removing parking in front of people’s homes on the A4, compulsory purchase of strips of front gardens and cutting down scores of trees, like the current row of approximately 68 trees in the Chiswick section of the A4.
• What would you do here, where there’s not space to put in CS9 and keep any pavement for pedestrians?
• Maybe there’s more room on the south side?
• And after cutting off chunks of pedestrian access to make the space for CS9, you then have to start on the trees, and then finish with the parking!
We certainly don’t think that TfL would be up for rejigging the A4 a few feet first one way and then the other to allow CS9 to snake around the subway entrances, trees and and parking, and it actually gets more challenging towards Hammersmith with several subways built right up to the side of the road.
However, there are residential properties on the A4 which require access, thus making it impossible to take any more pavement space. So now a lane of the A4 is required, displacing traffic to Chiswick High Road and King Street. If we’re going to build a “proper superhighway” along the A4, closing down a lane would lead to considerable traffic displacement to the High Road. Not great for anyone. The A4 carries six times the traffic of the High Road (90,000 vehicles per day vs. 15,000 on the A315), so even if only 10% were displaced from a one third cut in capacity for a lane closure, that would add more than 50% to the traffic along the High Road.
As they say, where there’s a will there’s a way. Just maybe not in this case, hopefully.

People proposing the A4 have different motivations for doing so. It is the most convenient route for some people, and they would like to see the cycling facilities improved there, as do we. For others, proposing the A4 seems to be a coded way of saying “get those cyclists away from me”, and others may genuinely think it is a better solution but without actually having to look the detail. Whatever their motivations, advocates of the A4 route really need to provide more than the most basic of evidence for why their proposal is the better option, rather than relying on guesswork and gut feelings for their case.

In conclusion, we see no other route but to place CS9 along the route that has received clear majority backing in the consultation. With the growth of cycling as a mode of everyday transport in London, doing nothing is not an option, and although it’s fine to suggest alternatives, we need to hear clear, evidence-based reasoning for these options.

Casualty Statistics 2005-2012

These charts and tables have been sourced from Travel Independent’s statistics for Hammersmith and Fulham and are based on Department for Transport casualty data, with some overall data added from the Department for Transport’s annual report. A road casualty is someone who is killed or seriously injured on the roads. It’s important to understand that there is no entirely accurate figure for deaths and especially injuries on the roads. The deaths of people on our roads should not be mere statistics, thankfully as a matter of policy TfL do aim to name every person killed who was riding a bike so we can name three of the four deaths in this period and give some context (see end).

To set this in some national context, here is the commentary in the latest Department for Transport (DfT) report (2012 report, page 22).

Pedal cycle KSI casualties have risen steadily since 2004 as have cycling traffic levels.
In 2012 the number was 32 per cent higher than the 2005-09 average; over the same
period pedal cycle traffic increased by 12 per cent

This is clearly a challenge to the belief that many have that there is a safety in numbers effect for cycling. What is also interesting is the distribution of casualties. As DfT have it:

The three vulnerable road user groups (pedestrians, pedal cyclists and motorcyclists) between them account for almost 50 per cent of all deaths and 60 per cent of all seriously injured casualties.

Proportion of reported casualties by road user type and severity, adjusted for distance  travelled per year, Great Britain: 2012 (page 23 of linked report)
Proportion of reported casualties by road user type and severity, adjusted for distance
travelled per year, Great Britain: 2012 (page 23 of 2012 report)

Continue reading Casualty Statistics 2005-2012

Agenda for October 2013 meeting

Meeting on Tuesday 8th October 2013, 7;15PM for a 7:30PM start

At the home of John Griffiths, 122C Edith Road W14 9AP – [corner of North End Road]

07789 095 748 john [at] truefeelings.com

There will be refreshments, please RSVP to John as early as you can to confirm you are able to make it. Apologies may go to John or Alex.

  1. Welcome to new members
  2. Update on ongoing issues – Hammersmith Bridge, Superhighway 9
  3. Flyunder Summit
  4. Update on website and social media
  5. Space4Cycling and involving the membership
  6. Central LCC matters – AGM on Saturday 19th October
  7. Expenses
  8. Date and Venue for next meeting
  9. Any Other Business?

Hammersmith Flyunder – The Story So Far

In the winter of 2011/12 the Hammersmith Flyover on the A4 road heading from Central London towards Heathrow had restrictions placed on it as an emergency measure due to unforeseen deterioration in the structure. Around £10m was spent on the emergency work to keep the flyover usable for some years.

A group of local architects proposed that the best way to deal with the Hammersmith Flyover was to replace it with a ‘flyunder’, a tunnel running through Hammersmith for the A4 road. This scheme got some traction with the media and council, as this BBC report from May 2013 shows.

In the wake of the Mayor’s Road Task Force report, which had some focus on the A4 corridor, Hammersmith and Fulham council have appointed a champion, created a webpage for comments, organised a summit and created some groups to discuss the flyover of which we are involved in one. The plan is to come up with a proposal before the local elections in 2014 to pass to TfL to develop the fuller plan.

Meanwhile, the Hammersmith Flyover sits being repaired at great expense by TfL, and they tell the construction press it will be “open for traffic for decades to come” after a combined repair cost of around £70m

Interpreting the cycling figures for Hammersmith and Fulham in the 2011 Census

Earlier in the year statistics from the 2011 census caused quite a stir amongst cycle campaigners. Hackney rejoiced that cycling was becoming a greater proportion of commuting journeys than driving and meanwhile Cyclists in the City made some lovely charts which also show that Hammersmith & Fulham is one of the leading cycling boroughs in London (we’re 4th).

Percentage of people who travel to work and do so by bicycle 2011 census cyclistsinthecity2

To find out what that actually means locally we thought we should examine the figures with a purely Hammersmith and Fulham focus. The Office of National Statistics provide a map tool to compare 2001 and 2011 census data. For the borough of Hammersmith and Fulham this provides the following table for comparing journeys to work. Note that such commuting journeys are typically the highest modal share for cycling, rather than utility (shopping, visiting your relatives) and leisure (heading for Richmond Park on a sunny afternoon). The figure for cycling as a share of all trips is typically around 2-3%.

Journey to Work, 2011 Local Authority Name: Hammersmith and Fulham

2001 2011
Work mainly at or from home (%) 8.88 10.75
Underground, metro, light rail, tram (%) 37.63 37.79
Train (%) 3.67 4.26
Bus, minibus or coach (%) 10.71 13.39
Taxi (%) 0.51 0.37
Motorcycle, scooter or moped (%) 2.2 2.06
Driving a car or van (%) 17.97 11.07
Passenger in a car or van (%) 1.03 0.68
Vehicle Occupancy Rate 1.06 1.06
Bicycle (%) 4.75 7.12
On foot (%) 12.13 11.99
Other method of travel to work (%) 0.52 0.53

The 2011 data has been provided at a ward level, which gives us this thrilling league table, and the knowledge that as a whole, Hammersmith and Fulham has 7,088 (approximately) resident cycle commuters in a population of 145,552.

Ward Bicycle %
Palace Riverside 357 9.22%
Askew 656 8.44%
Munster 548 8.33%
Ravenscourt Park 448 7.83%
Fulham Reach 497 7.70%
Fulham Broadway 469 7.60%
Shepherd’s Bush Green 521 7.55%
Sands End 489 7.32%
Addison 500 7.15%
Hammersmith Broadway 444 7.06%
Town 452 6.80%
Parsons Green and Walham 367 6.21%
Wormholt and White City 346 5.96%
Avonmore and Brook Green 400 5.90%
North End 407 5.90%
College Park and Old Oak 187 4.51%

It is of course also valuable to look at this data over a longer period and examine the change in behaviour.

Year Working Population Change Cycling to work % Change Cyclists Change
1991 64,760 3.80% 2,461
2001 83,023 28% 4.75% 25% 3,943 60%
2011 99,618 20% 7.12% 50% 7,088 80%

The working population of Hammersmith and Fulham has gone up strongly over the past two censuses. The proportion of cyclists in the working population has grown at 25% in 1991-2001 and then 50% in 2001-2011. Meanwhile the absolute number of cyclists has grown by 80% from just under 2,500 to just under 4,000 in 1991-2001 and then to over 7,000 in 2001-2011.

Strong that growth may sound, Hammersmith and Fulham actually missed the targets that had been set nationally, these targets were to double 1996 levels of cycling by 2002, and to double them by 2012. Amusingly after the 2002 target was missed the 2012 target was to increase on 1996 to triple or quadruple! It’s also worth noting that a previous vision for cycling, the London Cycle Network (LCN) envisaged a 10% modal share by around 2012 as well. The Mayor’s Cycling Vision more sanely proposes a doubling of cycling, again over ten years.

That would take us to 14,000 commuting cyclists (assuming the growth is even in commuting, and that Hammersmith evenly with London) making a 14% share of journeys, assuming the population is stable. However, with opportunity areas and many housing developments in the borough the absolute capacity of cyclists necessary to plan for may be far higher.  What matters, is that as the earlier tables showed a 14% share of commuting journeys for cycling would almost certainly make it the second most popular mode of travel to work after the tube, and more popular than buses.

RideLondon 2013

On the weekend of 9/10 August 2013, the revamped, rescheduled and renamed annual festival of cycling supported by TfL RideLondon took place. The media focus was largely on the Sunday which saw Boris Johnson and around 16,000 others take part in a marathon style challenge to ride 100 miles in Surrey and back (via Hammersmith and Fulham over the flyover) and then a professional race later in the day.

We meanwhile, had a strong involvement in the Saturday even, a ‘freecycle’ enabling 50,000 people including many families with members young and old alike to cycle in safety and pleasure on closed roads around St James’s Park, along the embankment up to Tower Hill and back. 70 fellow riders accompanied us from out start in Brook Green.