Background
The bridge is a listed building, having Grade II* status. Grade II* buildings are particularly important buildings of more than special interest – 92% of listed buildings are Grade II, 5.5% are Grade II*, and 2.5% are Grade I.
There are indications that the Hammersmith and Fulham Historic Buildings Group would probably not object to markings on the road, but may be expected to object to signs and traffic signals on the bridge itself.
The bridge has a weight limit of 7.5 tonnes. At either approach there is a width restrictor, with a bus gate to allow buses to pass. Only single-decker buses operate on the bridge.
Apart from being a busy commuter route for cyclists, the bridge also links the nursery slopes of the towpath on one side and the riverside route on the other. Many families with young children are to be seen cycling on either side of the river.
A recent count by hfcyclists on a Thursday morning, 24 October 2013, showed that the northbound traffic between 8am and 9am comprised Buses 55, Vans 130, Cars 464, P2W 137, Cycles 340. Motorised Total – 786 vehicles/hr.
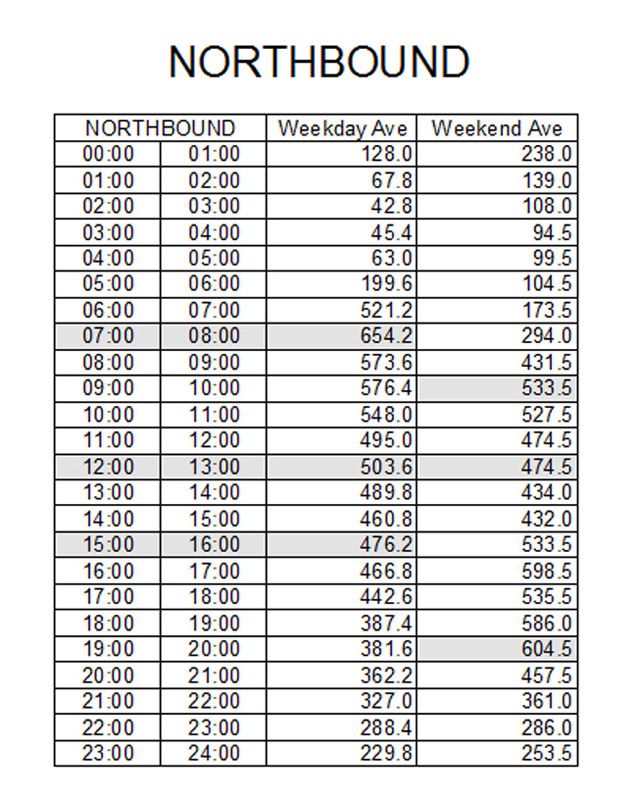
A radar count was commissioned by LBHF for week commencing 16 Sept 2012. [not known at present which vehicles this covers]
This gave an average peak weekday morning flow northbound of 654 vehicles/hr [7am – 8am]
This gave an average peak weekday evening flow southbound of 959 vehicles/hr [6pm – 7pm]
More on traffic counts / speeds at end of this page.
Dimensions
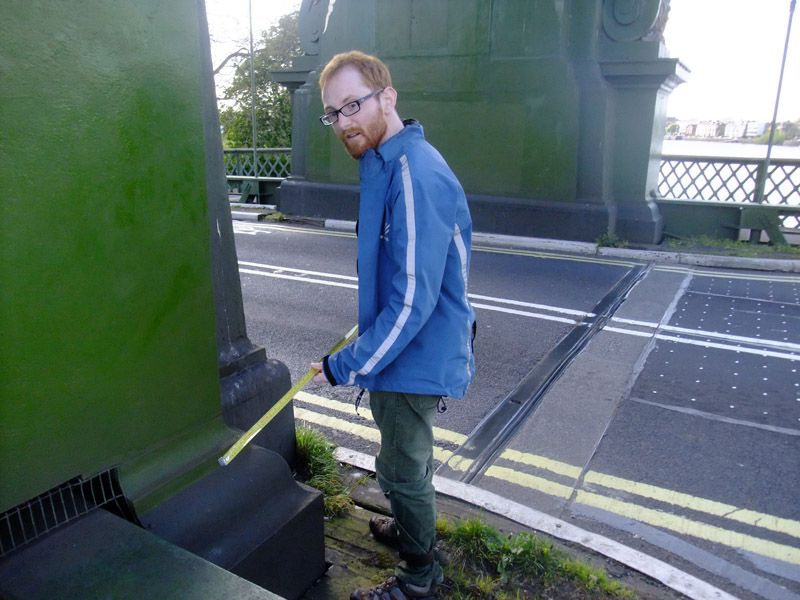 Narrow sections kerb to kerb = 6.0m
Wide sections kerb to kerb = 8.0m
Total length of Bridge = 280m. This is from where traffic signals would be placed at the either end of the bridge.
External reservoirs
From the end of the bridge going north to the roundabout, 150m
From the end of the bridge going south to the Lonsdale rd junction, 200m [There is a width restrictor in the northbound flow here]
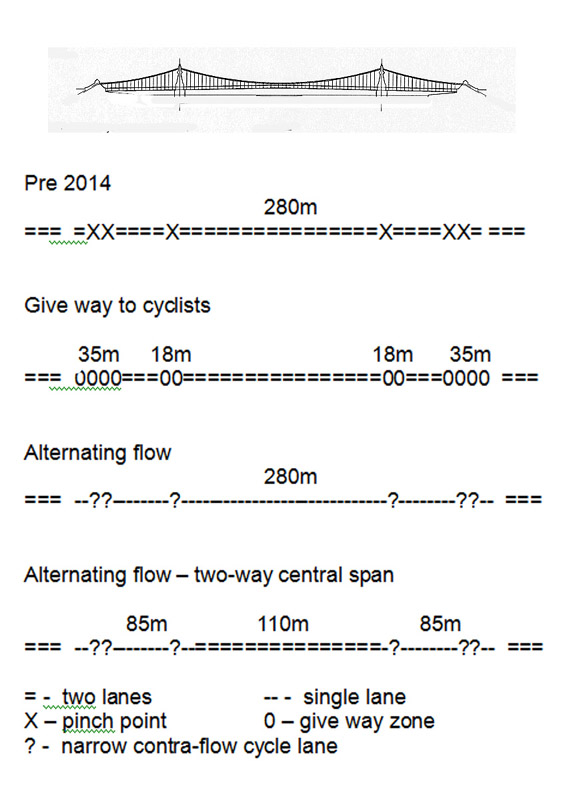
This diagram shows the dimensions for the various concepts.
Assumptions
Vehicle Speed On The Bridge
We will use a motor traffic speed of 22mph [10m/s] and a cyclist speed of 11mph [5m/s]
Rate Of Vehicles Moving Away From Lights
Various observations gave rates from 1 vehicle per 1 second to 1 vehicle per 3 sec. In our calculations we will use 1 vehicle per 2.4 seconds.
The following diagram gives a traffic flow rate of 1 vehicle per 2.4sec [1500 vehicles / hr] at 22 mph for continuous flow.
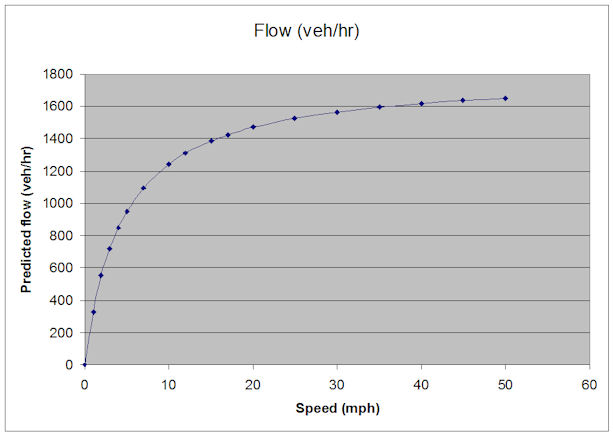 from http://www.transportpolicy.org.uk/Future/20mph/20mph.htm
The New Concepts
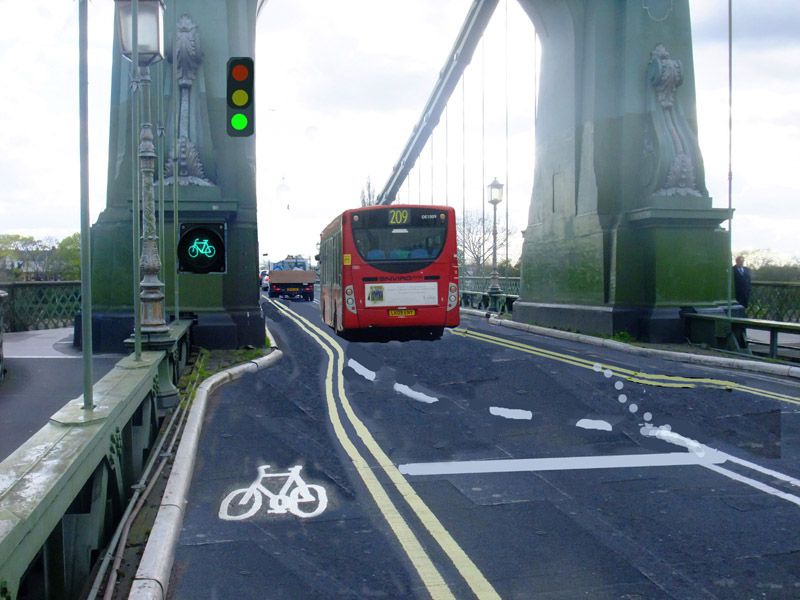
Concept 1 – Give Way To Cyclists At Pinch Points
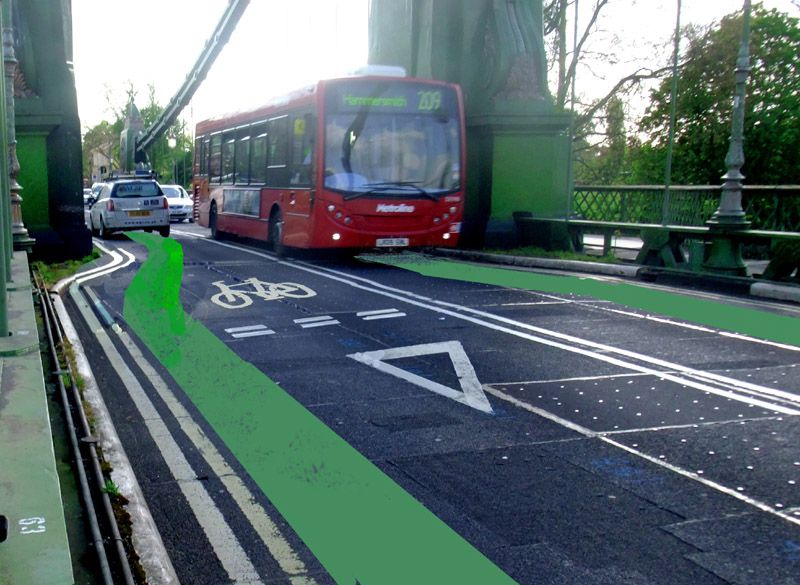 What would be the likely delay to a motorist?
The cyclist priority sections are 35m, 18m, 18m, 35m, that is 106m in all. The overall length of the bridge is 280m
Assume a motor travels at 10m/s [22mph]
Assume a cyclist travels at 5m/s [11mph]
The journey time for a cyclist is 280 / 5 = 56 seconds.
From 8am to 9am northbound on a weekday morning there were 340 cycles /hr.
So at any time in the peak hour one may expect
340 x 56 / 3600 = 5.3 cyclists on the bridge.
But a driver setting out will not come across them all, as some are getting away. The driver will only come across 1- Vb/Vv of them [ velocities of bike and vehicle]. In our case this is half of the cyclists, ie 2.6 cyclists.
Interestingly the faster the driver is going the more often the vehicle will come across a cyclist.
But only 106m of the 280m of the bridge is cyclist priority. So a driver may expect to be impeded by 2.6 x 10⁶ / 280 = 1.0 cyclist as the driver crosses the bridge.
The cyclist travels at 5m/s,
Time for a cyclist to cross 35m = 7s, Time for vehicle to cross = 3.5s. So delay to driver in this section 3.5s
Similarly for the 18m section, delay to driver = 1.8s
These are the delays if the cyclist is at the beginning of a one-lane section. So the delay on average is half of that.
Adding a bit of time for slowing down and accelerating again, a motorist is only likely to be held up by 5 seconds or so when crossing the bridge.
When fewer cyclists are around there is unlikely to be any delay at all.
The Calculations For The Other Proposals
The following calculations may be considered approximate.
They do not take into account the possibility of a reduced landing space after the bridge, or of an increased space as the head of the convoy moves out of the reservoir. We may not have chosen the appropriate rate for traffic moving away from a signal. The slow compaction of traffic as it comes to rest may interfere with clearing of single lane sections sections. And we have assumed an acceleration of 0 to 22mph in 0 sec
The calculations are based on 20 vehicles passing at a time. This number was chosen as the vehicles should be able to fit into receiving reservoir, even though they may be slow compacting. The length of time the bridge is open in one direction can obviously be controlled to fit the time of day and the direction of greater demand.
SCOOT signal operations might be employed to ensure that the receiving reservoir does not back up and block the bridge for the next phase in the other direction.
The calculations are useful as a guide and to get others to do more refined work and to promote discussion.
You are welcome to come up with your own workings.
Concept 2 – Simple Alternating Flow
 What will the flow be?
Assume we are dealing with a convoy of 20 vehicles, average length of a vehicle 4m, stacked at a length of 6m / vehicle. This requires 120m of space.
Assume the vehicles travel on the bridge at 10m/s [22mph], and ignoring time to accelerate.
At one vehicle / 2.4 sec, time for the whole convoy to pass the entrance of the bridge = 20 x 2.4 = 48s
Time for last vehicle to reach the end of the bridge = 280m / 10m/s = 28s
Total = 76s
Full Cycle time = 152s
In each direction, vehicles per /hr = 20 x3600 / 152 = 474
If a pedestrian-operated crossing phase of 10 seconds were to be included twice in the cycle, this would increase the full cycle time when operated to 172s.
This would give
Vehicles per /hr = 20 x3600 / 172 = 419
Concept 3 – Alternating Flow With Two-Way Central Span
 What will the flow be in this case.
There may be 18 vehicles stacked on the 110m of the bridge that had two lanes. The signals at the start of the bridge and on the central span go green.
At one vehicle / 2.4 sec, the time for 20 vehicles to pass is 20 x 2.4 = 48s.
The lights then go to red and It takes 85 / 10 =8.5s for the vehicles to clear the 85m one way sections.
This gives a cycle time 2 x [48 + 8.5] = 113 seconds.
In each direction, vehicles per /hr = 20 x3600 / 113 = 637
If a pedestrian-operated crossing phase of 10 seconds were to be included twice in the cycle, this would increase the cycle time when operated to 133s.
This would give
Vehicles per /hr = 20 x3600 / 133 = 541
Contact Us
Mock-ups and calculations provided by John Griffiths with support from Alex Ingram
John Griffiths, Chair hfcyclists
john@truefeelings.com
020 7371 1290 / 07789 095 748
Alex Ingram, Coordinator and Vice-chair hfcyclists.
alex@hfcyclists.org.uk
Further Traffic Data