
Our ask in the Fulham Reach ward of Hammersmith and Fulham proposes:
 Safe prioritised junctions over Fulham Palace Road
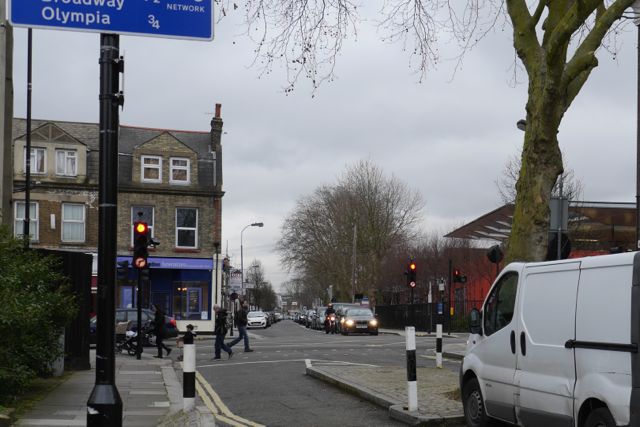
Fulham Palace Road is regularly congested and presents only intermittent space for cycling. To enable better use of the existing parallel quiet route improved junctions should provide clear space to enable cyclists to reach this route, thus enabling journeys to change and relieve congestion for all. This would also reduce severance for pedestrians if accompanied with changes in the prioritisation of lights.
![]()
You can support this ask on the main Space For Cycling site, or look at our full campaign promoting Space For Cycling in Hammersmith and Fulham. Or you can read on for our supporting evidence.
Supporting statistics for this proposal
For each of the wards we have combined a series of local statistics on traffic, the use of the local area and air quality to give an idea of the current situations in numerical terms. Each of these are presented in standard tables, followed by some commentary. We’ve attempted to summarise statistics in years between elections, which means the latest statistics are only for three years rather than four (highlighted by a *).
| KSI by mode | 2010-12* | 2006-09 | 2002-05 |
| Cycle | 3 | 5 | 0 |
| Pedestrian | 5 | 12 | 10 |
| Vehicle | 10 | 18 | 17 |
KSI is the sum of deaths and serious injuries from collisions. In this ward figures are intriguing. In 02-05 when there was likely less cycling there were 0 cycling KSIs. These have grown to 5 in the following period, but 3 in recent years. Pedestrian KSIs show a more encouraging trend and worryingly this ward shows one of the higher rates for vehicular KSIs. Our wider desire for 20mph zones present a good simple opportunity to tackle this rate for all road users.
| Traffic by Mode | 2010-12 | 2006-09 | 2002-05 |
| Cycle | 153 | 149 | 100 |
| P2W | 91 | 100 | 100 |
| Car | 91 | 99 | 100 |
| Vans | 87 | 101 | 100 |
| Bus | 117 | 108 | 100 |
| MGV | 81 | 78 | 100 |
| HGV | 83 | 100 | 100 |
| Motors | 92 | 99 | 100 |
There are 2 DfT count points in this ward. Taking 2002-05 as a base of 100, it is clear that cycling increased during the 06-09 period and has held steady. Car use is declining somewhat, as are other motor vehicles.
There are 4 schools in this ward with a total of 1430 pupils.
| Air Quality (ug/m3 annual mean) | 2008 | 2011 | 2015 Target | 2011 achieved |
| PM10 | 19.99 | 19.06 | -31% | -5% |
| NOx | 72.18 | 61.12 | -35% | -15% |
| NO2 | 41.38 | 37.53 | N/A | -9% |
Air quality in this ward has come inside the EU limit for NO2 (40 ug/m3) in recent years but only just. Reductions in PM10 by 2011 make reaching the 2015 target doubtful.
| Census | 2011 | 2001 | Change |
| Cars/Vans | 2522 | 3016 | -494 |
| Cars/Vans per 1000 people | 266 | 367 | -101 |
| Households | 4941 | 4500 | 441 |
| with no access to car/van | 2856 | 2135 | 721 |
| % | 58% | 47% | 10% |
In the most recent census we can see that there has been a decline of 494 in cars and vans owned in this ward. 58% of households have no access to a car or van.
| Journey to Work | 2011 | 2001 | Change |
| Residents counted | 9470 | 8214 | +1256 (+15%) |
| Not employed | 3016 (31.8%) | 2838 (34.6%) | +178 (+6%) |
| Homeworker | 555 (5.9%) | 416 (5.1%) | +139 (+33%) |
| Commuting residents | 5899 (62.3%) | 4960 (60.4%) | +939 (+19%) |
| Bicycle | 497 (8.4%) | 248 (5%) | +249 (+100%) |
| On foot | 978 (16.6%) | 868 (17.5%) | +110 (+13%) |
| Motorbike/moped | 111 (1.9%) | 91 (1.8%) | +20 (+22%) |
| Car/van driver | 661 (11.2%) | 901 (18.2%) | -240 (-27%) |
| Car/van passenger | 36 (0.6%) | 53 (1.1%) | -17 (-32%) |
| Tube | 2518 (42.7%) | 1970 (39.7%) | +548 (+28%) |
| Train | 203 (3.4%) | 187 (3.8%) | +16 (+9%) |
| Bus | 846 (14.3%) | 588 (11.9%) | +258 (+44%) |
| Taxi | 19 (0.3%) | 27 (0.5%) | -8 (-30%) |
| Other | 30 (0.5%) | 27 (0.5%) | +3 (+11%) |
The census shows striking changes in car use again with 27% fewer residents commuting by car. The greatest percentage increase has been in cycling but still only 497 residents commute by bicycle.