
Our ask in the College Park and Old Oak ward of Hammersmith and Fulham proposes:
 Safe passage to the north of the borough with protected space on Wood Lane
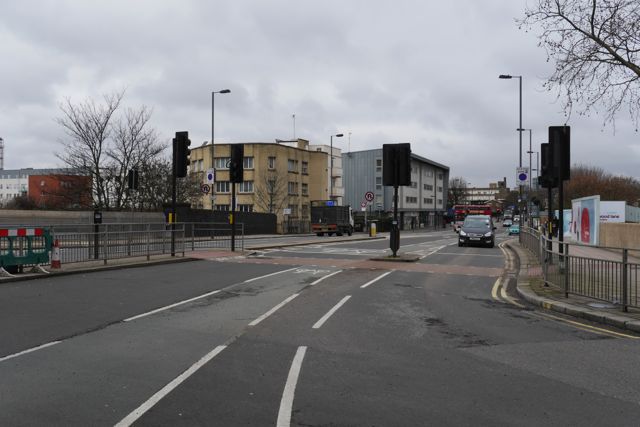
Wood Lane is a road with plenty of space much of which is presently wasted. In an area that is increasingly residential and provides inadequate cycling facilities we seek major changes. Cars stack in queues along with buses that block junctions, whilst poor unprotected space is provided at junctions with a major dual carriageway. Consistent facilities and a 20mph limit where roads must be shared should be pursued.
![]()
You can support this ask on the main Space For Cycling site, or look at our full campaign promoting Space For Cycling in Hammersmith and Fulham. Or you can read on for our supporting evidence.
We’ve written a news piece noting the existing issues with potholes on Wood Lane, which further supports our case for protected space here.
Supporting statistics for this proposal
For each of the wards we have combined a series of local statistics on traffic, the use of the local area and air quality to give an idea of the current situations in numerical terms. Each of these are presented in standard tables, followed by some commentary. We’ve attempted to summarise statistics in years between elections, which means the latest statistics are only for three years rather than four (highlighted by a *).
| KSI by mode | 2010-12* | 2006-09 | 2002-05 |
| Cycle | 3 | 2 | 7 |
| Pedestrian | 5 | 8 | 8 |
| Vehicle | 14 | 19 | 33 |
KSI is the sum of deaths and serious injuries from collisions. In this ward there have been dramatic improvements in safety for those in vehicles with modest improvements for those on cycles.
| Traffic by Mode | 2010-12 | 2006-09 | 2002-05 |
| Cycle | 126 | 94 | 100 |
| P2W | 120 | 142 | 100 |
| Car | 90 | 89 | 100 |
| Vans | 105 | 117 | 100 |
| Bus | 141 | 118 | 100 |
| MGV | 112 | 115 | 100 |
| HGV | 93 | 93 | 100 |
| Motors | 94 | 95 | 100 |
There are 4 DfT count points in this ward. Taking 2002-05 as a base of 100, cycling actually declined in 06-09 but has now recovered and grown modestly. Car use is declining, and the volume of buses is increasing fastest of all. Buses pose some risk to vulnerable road users given their weight though most London buses possess few genuine blind spots. The growth in MGVs perhaps relates to some of the vehicles serving the industrial site at the north of the ward.
There are 5 schools in this ward with a total of 1945 pupils.
| Air Quality (ug/m3 annual mean) | 2008 | 2011 | 2015 Target | 2011 achieved |
| PM10 | 20.33 | 19.13 | -31% | -6% |
| NOx | 79.41 | 69.69 | -35% | -12% |
| NO2 | 42.67 | 39.32 | N/A | -8% |
Air quality in this ward has come inside the EU limit for NO2 (40 ug/m3) in recent years but only just. Reductions in PM10 by 2011 make reaching the 2015 target doubtful.
| Census | 2011 | 2001 | Change |
| Cars/Vans | 1583 | 1656 | -73 |
| Cars/Vans per 1000 people | 228 | 287 | -59 |
| Households | 3674 | 3199 | 475 |
| with no access to car/van | 2319 | 1816 | 503 |
| % | 63% | 57% | 6% |
In the most recent census we can see that there has been only a slight decline in cars or vans owned in the ward, but a sharp growth in households. This has led to an increase in households with no access to a car or van of 63%, among the highest in the borough.
| Journey to Work | 2011 | 2001 | Change |
| Residents counted | 6945 | 5761 | +1184 (+21%) |
| Not employed | 2801 (40.3%) | 2742 (47.6%) | +59 (+2%) |
| Homeworker | 318 (4.6%) | 203 (3.5%) | +115 (+57%) |
| Commuting residents | 3826 (55.1%) | 2816 (48.9%) | +1010 (+36%) |
| Bicycle | 187 (4.9%) | 105 (3.7%) | +82 (+78%) |
| On foot | 632 (16.5%) | 447 (15.9%) | +185 (+41%) |
| Motorbike/moped | 39 (1%) | 30 (1.1%) | +9 (+30%) |
| Car/van driver | 592 (15.5%) | 619 (22%) | -27 (-4%) |
| Car/van passenger | 35 (0.9%) | 36 (1.3%) | -1 (-3%) |
| Tube | 1215 (31.8%) | 841 (29.9%) | +374 (+44%) |
| Train | 247 (6.5%) | 162 (5.8%) | +85 (+52%) |
| Bus | 853 (22.3%) | 548 (19.5%) | +305 (+56%) |
| Taxi | 15 (0.4%) | 8 (0.3%) | +7 (+88%) |
| Other | 11 (0.3%) | 20 (0.7%) | -9 (-45%) |
Car use in this ward shoes less of the decline in other areas, though it would appear many of the new households and residents (an extra 1010 commuters from 2001-2011) use modes other than the private car to get to work. Cycling rates appear rather low, despite recent increases.