
Our ask in the Avonmore and Brook Green ward of Hammersmith and Fulham proposes:
 Connecting neighbourhoods over Hammersmith Road, by the A4 and around Olympia by making the one way streets in the area, two way for cycling.
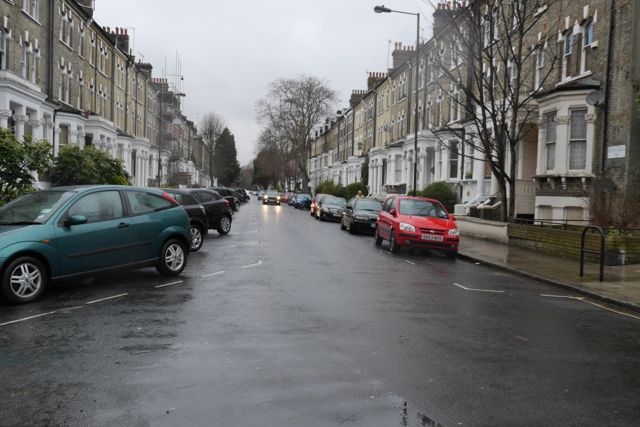
A number of one-way roads currently work against making cycling convenient and safe in this area. Edith Road, Olympia Way and the set of roads around Olympia could be much more permeable.
![]()
You can support this ask on the main Space For Cycling site, or look at our full campaign promoting Space For Cycling in Hammersmith and Fulham. Or you can read on for our supporting evidence.
Supporting statistics for this proposal
For each of the wards we have combined a series of local statistics on traffic, the use of the local area and air quality to give an idea of the current situations in numerical terms. Each of these are presented in standard tables, followed by some commentary. We’ve attempted to summarise statistics in years between elections, which means the latest statistics are only for three years rather than four (highlighted by a *).
| KSI by mode | 2010-12* | 2006-09 | 2002-05 |
| Cycle | 3 | 5 | 4 |
| Pedestrian | 1 | 6 | 8 |
| Vehicle | 2 | 4 | 16 |
KSI is the sum of deaths and serious injuries from collisions. In this ward there have been dramatic improvements in safety for those in vehicles and on foot, with no improvement for those on cycles.
| Traffic by Mode | 2010-12 | 2006-09 | 2002-05 |
| Cycle | 142 | 142 | 100 |
| P2W | 82 | 104 | 100 |
| Car | 88 | 95 | 100 |
| Vans | 93 | 110 | 100 |
| Bus | 100 | 112 | 100 |
| MGV | 108 | 108 | 100 |
| HGV | 106 | 117 | 100 |
| Motors | 89 | 97 | 100 |
There are 3 DfT count points in this ward. Taking 2002-05 as a base of 100, it is clear that cycling increased during the 06-09 period and has held steady. Car use is declining, but there are increases in MGV and HGV (medium and heavy goods vehicles) which pose a serious risk to vulnerable road users.
There are 8 schools in this ward with a total of 2660 pupils.
| Air Quality (ug/m3 annual mean) | 2008 | 2011 | 2015 Target | 2011 achieved |
| PM10 | 20.69 | 19.68 | -31% | -5% |
| NOx | 79.63 | 66.39 | -35% | -17% |
| NO2 | 43.7 | 39.33 | N/A | -10% |
Air quality in this ward has come inside the EU limit for NO2 (40 ug/m3) in recent years but only just. Reductions in PM10 by 2011 make reaching the 2015 target doubtful.
| Census | 2011 | 2001 | Change |
| Cars/Vans | 2699 | 3218 | -519 |
| Cars/Vans per 1000 people | 267 | 352 | -85 |
| Households | 5719 | 5451 | 268 |
| with no access to car/van | 3465 | 2821 | 644 |
| % | 61% | 52% | 9% |
In the most recent census we can see that there has been a decline of 519 in cars and vans owned in this ward. 61% of households have no access to a car or van.
| Journey to Work | 2011 | 2001 | Change |
| Residents counted | 10122 | 9155 | +967 (+11%) |
| Not employed | 3346 (33.1%) | 3286 (35.9%) | +60 (+2%) |
| Homeworker | 775 (7.7%) | 517 (5.6%) | +258 (+50%) |
| Commuting residents | 6001 (59.3%) | 5352 (58.5%) | +649 (+12%) |
| Bicycle | 402 (6.7%) | 250 (4.7%) | +152 (+61%) |
| On foot | 877 (14.6%) | 757 (14.1%) | +120 (+16%) |
| Motorbike/moped | 102 (1.7%) | 100 (1.9%) | +2 (+2%) |
| Car/van driver | 667 (11.1%) | 910 (17%) | -243 (-27%) |
| Car/van passenger | 43 (0.7%) | 65 (1.2%) | -22 (-34%) |
| Tube | 2791 (46.5%) | 2450 (45.8%) | +341 (+14%) |
| Train | 270 (4.5%) | 174 (3.3%) | +96 (+55%) |
| Bus | 809 (13.5%) | 597 (11.2%) | +212 (+36%) |
| Taxi | 14 (0.2%) | 26 (0.5%) | -12 (-46%) |
| Other | 26 (0.4%) | 23 (0.4%) | +3 (+13%) |
The census shows striking changes in car use again with 27% fewer residents commuting by car. The greatest percentage increase has been in cycling but still only 402 residents commute by bicycle.